
About a year ago we carried out some performance comparison tests of Solr (version 4.10) and Elasticsearch (version 1.2) and presented our results at search meetups. Our conclusion was that there was not a great deal of difference. Both search engines had more than adequate performance for the vast majority of applications, although Solr performed rather better with complex filter queries and supported a significantly higher QPS.
Since then, both Solr and Elasticsearch have released new major versions, so it seemed like a good time to do another comparison. This time, under our present test conditions, the results were reversed. Elasticsearch 2.0.0 was substantially faster than Solr 5.3.1 for searching, and could maintain more than twice the QPS under indexing load. Solr, on the other hand, supported much faster indexing and used less disk space for its indexes.
For various reasons, it was not practical to exactly duplicate the original tests. We used a single Amazon EC2 r3.4xlarge instance backed by 400GB of EBS storage. Both the Elasticsearch or Solr nodes and the test scripts were run on the same machine. The configuration of both search engines was as follows:
- 4 nodes
- 4 index shards
- no replication
- 16GB per node
Since the EC2 instance had 122GB of memory, this left 58GB for disk cache (minus whatever was used by the OS and the test scripts). The built-in instance of ZooKeeper was used for managing SolrCloud.
We created 20 million random documents, using (as before) a Markov chain trained on a document on the philosophy of Stoicism downloaded from gutenberg.org. Random integers were also generated for use as filters and facets. In both search engines, the text was indexed but not stored. Other fields were both indexed and stored (in Elasticsearch, _source and _all were disabled).
We indexed the documents into Elasticsearch or Solr using two concurrent instances of a Python script, with a batch size of 1000 documents. Solr was configured to do a soft commit every 1s, to be consistent with the default Elasticsearch behaviour. The elapsed indexing time for Solr was 66m 52s, while Elasticsearch took more than twice as long, at 142m 2s. The total index sizes were 38GB and 79GB respectively (update: see comments, this may be a mistake).
After indexing, we carried our search time tests under conditions of indexing load (2 processes as before) or no load. We also performed QPS tests in the loaded condition. In all cases, queries were composed of 3 OR terms, with three filters, and facets generated from the numeric terms. 5000 searches were run before all tests, to warm caches.
With no concurrent indexing load, Elasticsearch had a mean search time of 0.10s, with 99% of searches under 0.22s. For Solr, this was 0.12s and 0.54s (see figure 1). With an indexing load, Elasticsearch had a mean search time of 0.14s, with 99% below 0.34s. The same figures for Solr were 0.24s and 0.68s (figure 2). QPS tests were carried out with 1, 2, 4, 8, 16 and 32 concurrent search clients. Elasticsearch approached a maximum of 30 QPS, while Solr approached 15 (figure 3).
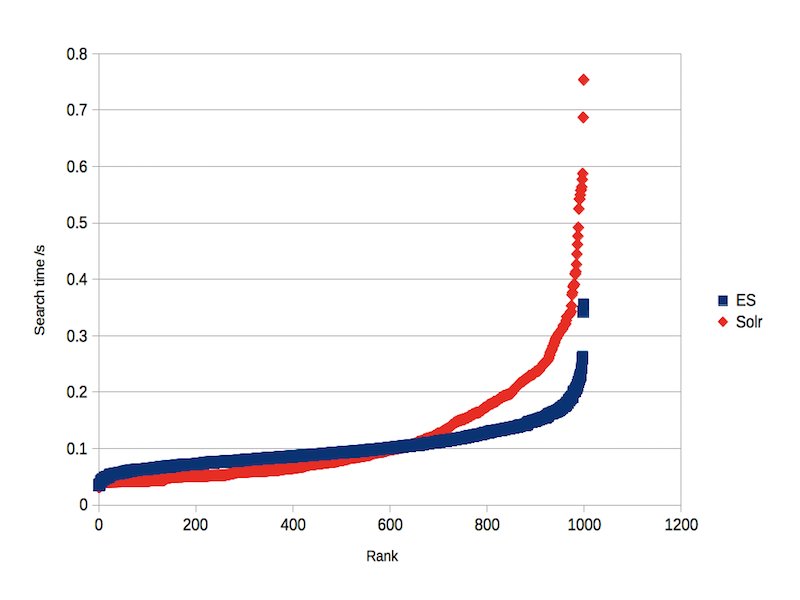
Figure 1: search time, no indexing load
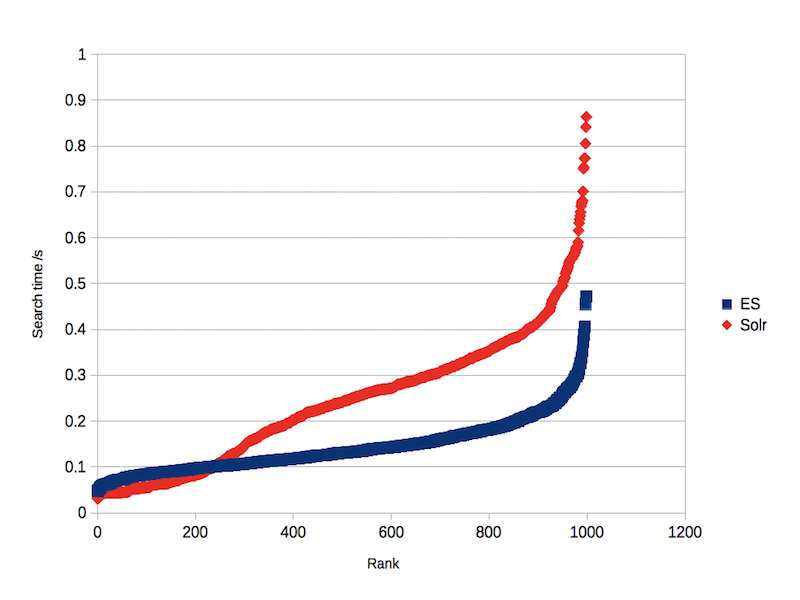
Figure 2: search time, with indexing load
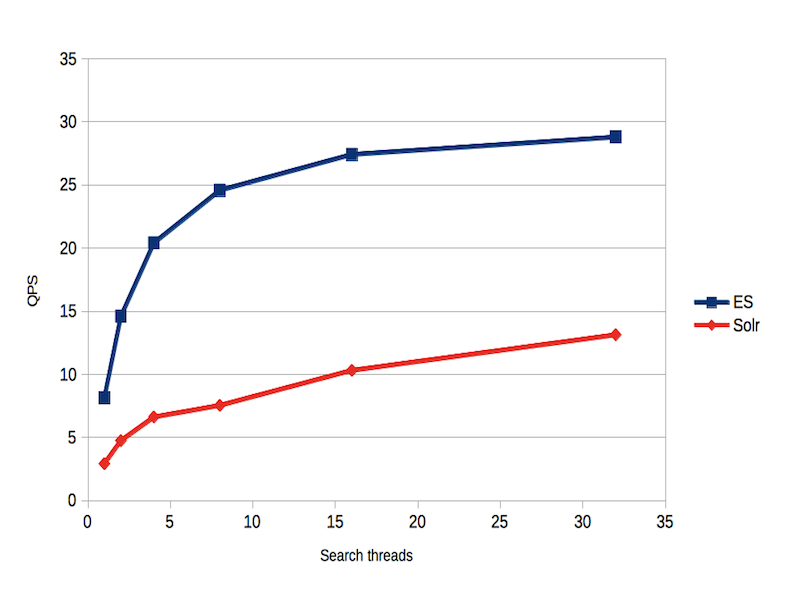
Figure 3: QPS with indexing load
Thus, under indexing load, Elasticsearch appeared to have approximately twice the search performance of Solr. It wasn’t clear why this might be the case. One idea which occurred to us was that the query execution changes announced for Elasticsearch 2 might be responsible. To test this, we also compared Elasticsearch 1.7.3 against the current version. The older version was slightly slower (99% of searches under 0.50s as opposed to 0.34s, figure 4) but this was a smaller difference than for Solr. The QPS test was inconclusive (figure 5).
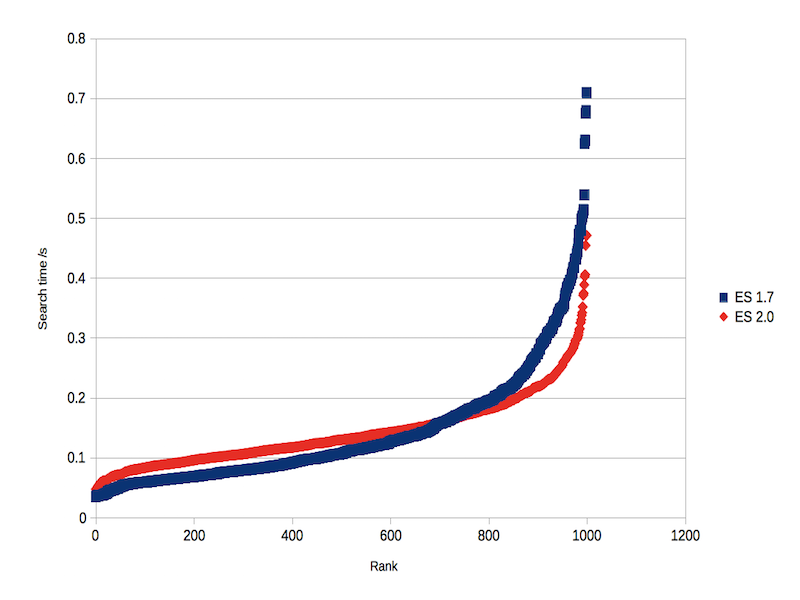
Figure 4: Search time, ES 1.7 vs. 2.0
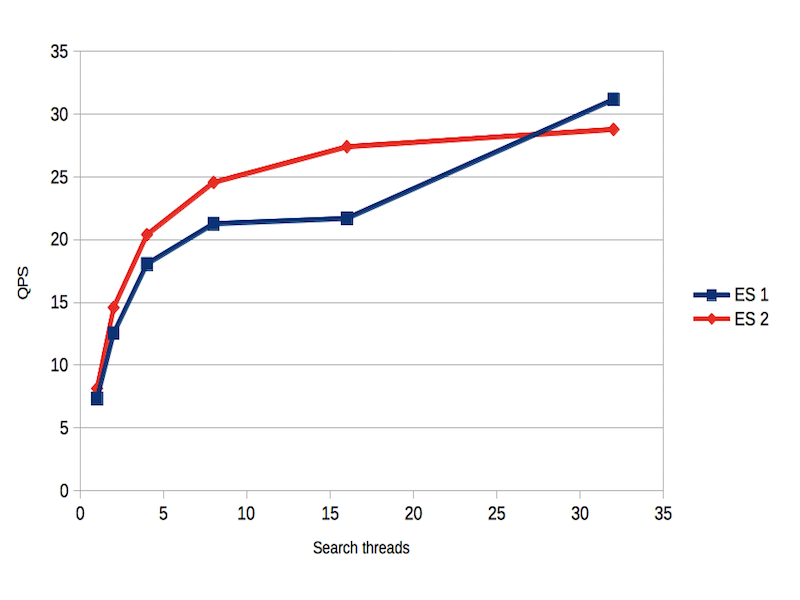
Figure 5: QPS, ES 1.7 vs 2.0
These results must be interpreted with caution. The first caveat is that we only tested a narrow range of either engine’s functionality, in one specific configuration. Other functional areas may perform very differently. Second, the runtime environment was fairly unrealistic. In practice, network latency and bandwidth are likely to have an effect on performance. Third, both engines were used more or less “out of the box”, with minimal effort put into tuning the performance of either.
There are also many factors other than raw performance to be taken into consideration when choosing a search engine. We are not saying that either choice is “better” than the other in all circumstances. However, if search performance is a critical factor in your system design, then it would pay to try both Solr and Elasticsearch, to see which would work better within your parameters.
The difference in performance in this study is interesting, but the reasons remain unclear, and we’d welcome any suggestions to refine our methodology, or similar studies.


Can you make sure you’ve allocated enough concurrent HTTP connections per host for ramping up query execution threads on the client side? In my query perf testing, I had to increase the pool size per host in the HTTP client lib and after doing so, Solr query performance went way up. Something like:
httpClientBuilder.setMaxConnPerRoute(100);
httpClientBuilder.setMaxConnTotal(500);
Thanks for the suggestion, but I’m only running up to 32 concurrent search threads (actually, processes), so I don’t think that this would be an issue. And I’m not seeing any connection errors, which I’d expect if I was running out of file descriptors.
The defaults on HttpClient limit the number of simultaneous connections per host to 2 and the maximum number of total connections (all hosts contacted by that httpclient instance) to 20.
When Solr creates the internal HttpClient for shard requests, it sets the max connections per host value to 20, and shares that client between all of the SolrClient objects that it uses. Because the index was sharded, depending on exactly how the query requests are made, 12 of them might end up waiting for one or more of the initial 20 requests to finish. There are configuration options on HttpShardHandlerFactory for changing the number of connections allowed.
>> “The total index sizes were 38GB and 79GB respectively.”
Independent of any index/query perf questions, a 2x discrepancy in size of the underlying indexes given identical starting data, seems REAAALLLLYYYY suspicious.
Although you didn’t specify in your writeup, I’m assuming this was the code you were using…
https://github.com/flaxsearch/solr-es-comparison
correct?
While I didn’t try to completely reproduce your entire benchmark, I did attempt a scaled down test of just building the initial index (consisting of 4 shards on one node) of 1 million docs based on the instructions in the README.md of that repo. I tested Solr 5.3.1 against ES 2.1 since they both use Lucene Core 5.3.1 under the covers.
(bear in mind, i don’t know much abou ES, so I may be misunderstanding something in the notes below)
What I found was that the total size of the resulting shards was nearly identical…
$ du -s elasticsearch/nodes/0/indices/speedtest/*/index
395800 elasticsearch/nodes/0/indices/speedtest/0/index
394680 elasticsearch/nodes/0/indices/speedtest/1/index
394788 elasticsearch/nodes/0/indices/speedtest/2/index
395564 elasticsearch/nodes/0/indices/speedtest/3/index
(total ES index size 1580832 bytes)
$ du -s node1/solr/speedtest_shard*_replica1/data/index
393740 node1/solr/speedtest_shard1_replica1/data/index
392432 node1/solr/speedtest_shard2_replica1/data/index
391876 node1/solr/speedtest_shard3_replica1/data/index
393320 node1/solr/speedtest_shard4_replica1/data/index
(total Solr index size 1571368 bytes)
The ES index is only 9464 byte larger then Solr, or 0.009 bytes/doc — something that seems negligible and possibly due to just some segment metadata (my ES index had 81 segments while Solr had 73)
But just in case there was more to it, I ran CheckIndex against all 8 lucene indexes and skimmed the results to find one segment from each system that had comparable size (in terms of both num docs & disk size) to try and dig deeper on…
checkindex-solr-shard4.txt: 6 of 18: name=_49 maxDoc=8325
checkindex-es-shard2.txt: 7 of 20: name=_8y maxDoc=8276
Both where ~12.9MP. When analyzing the CheckIndex output for these 2 segments, I found the 4 expected fields in common (id, level, source, text) with (mostly) comparable size/stats. The only notable discrepancies that jumped out at me…
Indexed fields only in one system or the other…
– ES: “_field_names” (7 terms)
– ES: “_type” (1 terms)
– ES: “_uid” (8276 terms, 132416 bytes)
– Solr: “_version_” (8325 terms, 28710 bytes)
Oddities in Common fields…
– “level” … ES has 8 terms, Solr has 5 (only 5 values in source data
– “source” … ES has 23 terms, Solr has 20 (only 20 values in source data)
Non-Indexed field oddities…
– ES has 5 docvalues fields, Solr has none.
The extra fields don’t seem to contribute much to an index size disparity. It’s hard to imagine them causing a 2x discrepancy in total index size as the index grows 20x documents … but i suppose in the case of “_uid” they could add up. Perhaps there is a way to disable some of these in ES if they are not critical to operation? In particular is it mandatory to have the “_uid”, “_field_names” & “_type” fields in ES even if you don’t query on them? If not you could use various UpdateProcessors in Solr to add the same fields to see if that really impacts the index size.
The difference in num terms for level & source seems to indicate that ES is using a default precisionStep for the numeric fields — Solr would also by default use a precisionStep for TrieIntFields, but in your schema.xml these fields explicitly declare a precisionStep=”0″ (if these fields used a type=”tint” instead of type=”int” that would probably be equivalent to ES?) … this might have a slight impact on the index size discrepancy, or on the Solr search speed, but I doubt it would be too noticable given the limited range of values being tested.
The biggest possible discrepancy I can see that might relate to the index size as the index grows to 20x the number of documents (and is definitely something that could be re-configured, even if things like the “_uid” field are mandatory) is the docvalues. It’s not clear to me from your write up just how significant these are to your query testing (any non-score sorts used?) but you might want to explictly enable them in your Solr schema.xml for any fields you are sorting/faceting against, to get a more apples-to-apples index size, indexing time, and query performance comparison.
But all told — even the “_uid” + docvalues don’t seem like enough to really explain such a huge size discrepancy. I would encourage you to either try reproducing your initial indexing results to verify there wasn’t a glitch somewhere, or post the CheckIndex output for all of your lucene indexes somewhere (gist.github.com?) so folks can try to make sense of that before putting to much stock in the final perf results based on those indexes.
In all likelihood, the 2x on-disk size is because they added a replica to the Elasticsearch test (even though the article says “no replication”): https://github.com/flaxsearch/solr-es-comparison/commit/7435464b77c7e7806c76a10f47641e112dad5e61
Which would basically double the index size, since a complete copy is being replicated.
I don’t know solr well enough to check if the config is the same, but I suspect it isn’t given the huge discrepancy.
My colleague @romseygeek has suggested that I might have measured the index size in the middle of a merge, which is possible and could certainly explain the size disparity and the difficulty in reproducing it.
I agree with Hoss that the mentioned discrepancy in index size is really strange. I took a look on Hoss’s posted github project and reviewed the elasticsearch index configuration. Contrarily to the writeup elasticsearch is configured with one replica causing the index to be duplicated. So if that code was really used for benchmarking that may be the reason for the size discrepancy.
https://github.com/flaxsearch/solr-es-comparison/blob/master/elasticsearch/index-config.json#L4
I think that “number_of_replicas” is the same as Solr’s replicationFactor, i.e. 1 means that there is 1 index for each shard (and no copies). Certainly when I tried setting it to 0, there was nothing searchable (although ES did not complain).
I’ve not managed to reproduce the index size discrepancy on a single node configuration, at up to 10M docs. Therefore I think it’s quite likely I made some stupid mistake in measuring the ES index size in the 4 node configuration, though as I no longer have that data available I unfortunately can’t check that. The next step is to do the performance tests on single nodes.
Sorry, that’s not how Elasticsearch shards work.
`number_of_shards` controls the number of primary shards that makeup a single index. For example, your test uses four primary shards, which means the index can be split across four machines total.
`number_of_replicas` controls the number of replica sets that are maintained alongside the primary shards. So in your test, you have one replica enabled. Which means there will be four primary shards + one complete set of replicas (another four shards), totaling 8 shards and twice the data.
I’m not sure why you weren’t able to search, but it wasn’t due to shards. ES will happily search a non-replicated index 🙂
OK, I’m confused now. I’ve just tried running one ES node, and configuring indexes with number_of_shards=1 and number_of_replicas=0, 1 and 2 (indexes s1r0, s1r1 and s1r2). When I add a document to each, I end up with the same index structure for the first two cases.
For the index where number_of_replicas=2, the PUT blocks (as you’d expect if there is no node available to handle the replica).
So it looks to me like the 0 and 1 number_of_replicas cases are handled identically, with no replica shards (and yes, I can search both). If I’m doing something stupid, please explain what!
Ah, I see. Nothing stupid on your end, just some nuances to how ES handles replicas… which become more apparent on single-node clusters.
The culprit is a setting called Write Consistency (https://www.elastic.co/guide/en/elasticsearch/reference/current/docs-index_.html#index-consistency), which comes into play when trying to index documents. Write consistency is a safety mechanism that helps to prevent writing to the wrong side of a split-brain (helps, but doesn’t prevent).
When trying to index a document, ES will first evaluate the cluster state to see if a quorum of shards are available. If a quorum is not available, it will simply refuse to index the document (after a sufficient timeout period to see if more nodes join).
So in the single node scenario where you specify two replicas, you need two available shards (1 primary + 2 replicas == 3 shards. Quorum of three is two).
The gotcha here is that Elasticsearch refuses to allocate replicas to the same machine as a primary, since that defeats the point of the replica (e.g. if the machine dies, you lose both copies of data). So in this single-node cluster, only the primaries are allocated regardless of replica count.
So the end result is that each index will have a single primary shard, and in the 2-replica case, that single primary does not satisfy the quorum needed to index, so the operation stalls and aborts.
If you were to spin up a second node, one replica would be allocated there and you’d be able to index because the quorum will now be satisfied.
@Zachary: perfect description!
Thanks for the clarification, Zachary, that’s interesting. So if this is done by host ID rather than node ID, I guess it explains why I didn’t have any replicas in the original 4-node case, since they were all running on the same host. (Not very realistic, I accept, but the same for both ES and Solr).
Another potential (perf related) issue with the setup: ES automatically assumes it has full run of the server. E.g. it set’s various threadpools based on multiples of the CPU core count. So unless these were isolated in VMs, the server was probably burning a lot of cycles in context switching (because there were 4x the appropriate number of threads). Ditto for Lucene merge scheduler threads, and merge throttling, etc.
I don’t know enough about Solr, but it could very well have run into the same problems. I imagine they scale threadpools/IO similarly (and definitely the Lucene components would)
The solution is to A) run them on their own machine, B) isolate with VMs and scale down core counts appropriately, or C) use the `processors` setting to tell ES how many cores are actually available (https://www.elastic.co/guide/en/elasticsearch/reference/current/modules-threadpool.html#processors)
🙂
Oops, sorry, this was supposed to be a reply to the other thread 🙂